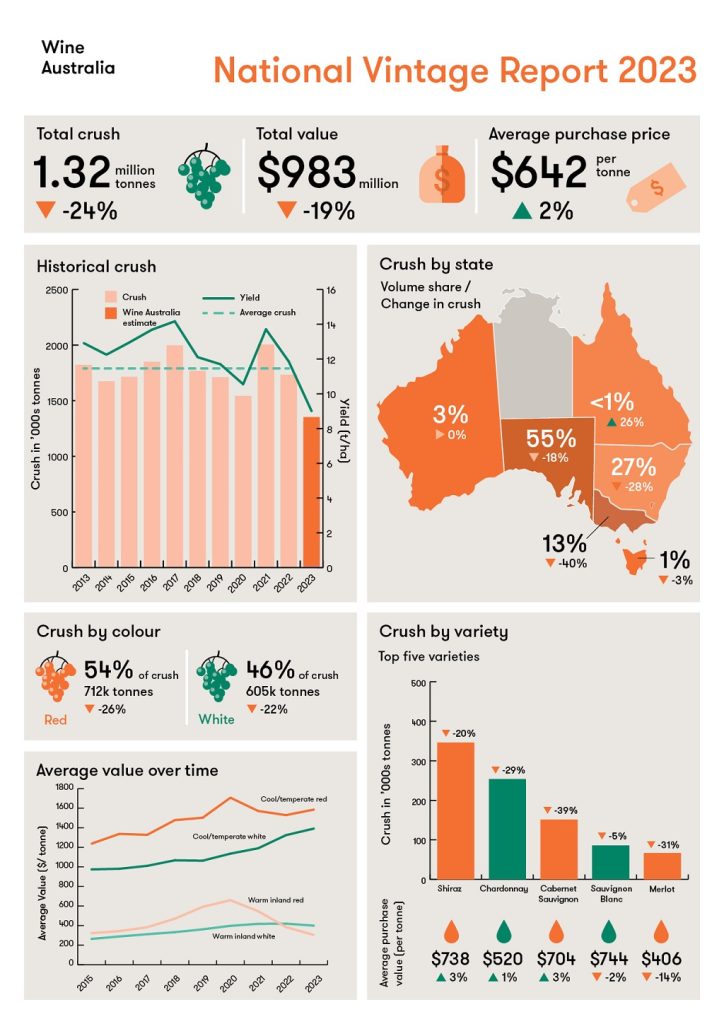
The 2023 Australian winegrape vintage is estimated to be 1.32 million tonnes, 26 per cent below the 10-year average and the lowest recorded since 2000, according to the National Vintage Report 2023 released today by Wine Australia.
The growing conditions in many regions were widely reported to be the most challenging in at least 20 years, but on the other hand, the exceptionally cool season was conducive to producing high quality fruit with excellent flavour development.
Wine Australia Manager, Market Insights, Peter Bailey said the second consecutive smaller vintage will have a direct impact on grape and wine businesses.
“This smaller vintage, which will reduce the wine available for sale by around 325 million litres, is likely to have a considerable impact on the bottom line of grape and wine businesses all around Australia, at a time when the costs of inputs, energy, labour and transport have increased significantly.”
A third consecutive La Niña event produced the wettest year since 2011 and it was also Australia’s coolest year since 2012. Persistent winter and spring rainfall across much of South-Eastern Australia made access to vineyards difficult as well as causing flooding in some regions. The cool, wet conditions through spring and summer in some regions also led to lower yields, delayed ripening and challenges managing disease.
Further reducing the size of the crush were winery inventory pressures resulting in some yield caps being imposed, uncontracted grapes not being sold and/or vineyards being temporarily taken out of production.
Mr Bailey said that it was impossible to determine what share of the overall reduction, compared with an average vintage, could be attributed to demand-driven effects as opposed to seasonal conditions.
“However, white grapes – which are in higher demand – were reduced by a similar percentage to reds, which suggests that seasonal effects were the main contributor to the reduction,” Mr Bailey said.
The crush of red grapes in 2023 is estimated to be 711,777 tonnes – a 26% reduction compared with 2022 and 25% below the 10-year average of 943,146 tonnes, while the white crush was an estimated 605,321 tonnes – a decrease of 22% compared with 2022 and 28% below its 10-year average of 839,013 tonnes (Figure 1).

Figure 1: Winegrape crush by colour 2013–2023
South Australia retained its position as the largest contributor to the crush, with a 55% share of the total, despite its second-smallest crush since 2007. New South Wales was second-largest with 27% of the crush, followed by Victoria with 13%. Western Australia, which overall had a very good season, increased its share to 3.5%, while Tasmania and Queensland each accounted for slightly less than 1%.
The main reduction in the crush came from the three large inland wine regions: the Riverland (South Australia), Murray Darling – Swan Hill (New South Wales and Victoria) and Riverina (New South Wales). The crush from these regions combined was down 28% to 899,936 tonnes, whereas the crush from the rest of Australia’s 59 GI wine regions and 26 GI zones together was only down by 15% compared with 2022, at 417,162 tonnes. This meant that the large inland regions reduced their share of the national crush to 68%, compared with the long-term average of 74%.
The total estimated value of the 2023 crush at the weighbridge was $983 million, a decrease of $229 million (19%) compared with the 2022 vintage and the lowest since 2015. The decline in value was less than the decline in tonnes, because of a small increase in the overall average purchase value, driven by an increase in the average value and share of grapes from cool-temperate regions.
The average value for the large inland regions’ purchased grapes decreased by 11% overall, driven by a 21% decline in reds and a smaller (5%) decline in whites (Figure 2). By contrast, the average value of purchased grapes in the other combined regions increased by 4% in 2023, with reds up by 3.6% and whites up by 5%.
Mr Bailey noted that this reflects the stronger market demand for premium wines than for commercial wines.
“Around the world, particularly in mature markets, there has been a long-term decline in commercial wine sales and an increase in premium sales. More recently, there has been growing demand for white wines. Both of these factors are reflected in the winegrape price trends”.

Figure 2: Average winegrape purchase value by colour 2015–2023
To assist winegrape growers, particularly in the inland regions, to be better informed regarding winegrape price indicators, Wine Australia is developing a Winegrape Supply and Demand Dashboard, as part of a project managed by Wine Australia, Australian Grape & Wine and the Inland Wine Regions Alliance, with funding through the Australian Government’s Improving Market Transparency in Perishable Agricultural Goods Industries initiative. The dashboard is expected to launch in October 2023.
The National Vintage Report is available from www.wineaustralia.com/market-insights/national-vintage-report and all vintage survey statistics from the past nine years is available on Wine Australia’s dashboard, https://marketexplorer.wineaustralia.com/vintage-survey.
Are you a Daily Wine News subscriber? If not, click here to join our mailing list. It’s free!
