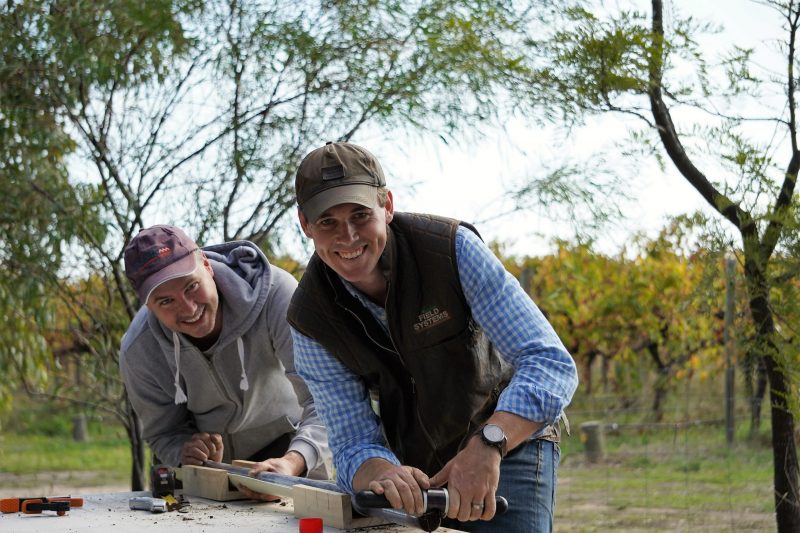
Image: Oli Madgett (left) and Ed Sott (right) opening a soil core.
Building up soil organic carbon (SOC) can improve our vineyards’ soil quality in many ways; improving soil structure, storing water and nutrients, and feeding vital soil organisms – all contributing towards a long-term strategy aimed at improving the resilience of vines in the face of increasing climate extremes.
With soil health a key component of maintaining a productive and resilient vineyard, Oli Madgett shares details about recent efforts to develop a method to baseline soil organic carbon levels utilising the latest technology and specifically suited to viticultural operations.
Sequestering carbon in the soil is one means of reducing atmospheric CO₂ and brands such as Pernod Ricard and Moët Hennesy are putting soil and sustainability at the heart of their strategies, with the latter investing €20m in a sustainable viticulture centre in the Champagne region and creating a ‘University of Living Soils’.
From a grower’s perspective, it makes good business sense for us to put improving soil health as a key component of our commercial strategy. Many vineyards are already adopting management practices designed to increase soil carbon: planting cover crops, stopping tillage in the mid rows, cutting out herbicide, grazing sheep in the offseason, spreading compost and mulch, and applying products such as kelp and humic acid through the irrigation system. Fellow grower Richard Leask, from McLaren Vale, is just finishing his Nuffield Scholarship where he’s been researching best practice regenerative farming systems across the wine sector in order to understand how to successfully transition from more chemically intensive models.¹
As well as the production benefits of increasing soil carbon levels, going forward the carbon that we can demonstrate we’re sequestering in our soils could earn us additional revenue through selling carbon credits, either through the Federal Government’s Emissions Reduction Fund or via the increasing number of private markets such as Nori.com or Indigo Carbon. Alternatively, growers can be using the increases in their soil carbon levels to offset their carbon emissions if they’re working towards being carbon neutral producers. There’s a great agtechsowhat.com podcast (Ep 61) with Alisdair Tulloch from Keith Tulloch Wines in the Hunter Valley talking about the first mover advantages of going carbon neutral from a wine brand’s perspective.
From a personal perspective, I wanted to baseline the soil carbon levels at our own vineyard in McLaren Vale so we had a robust starting point that we could use to measure our progress against. We are moving away from spraying herbicide and making improving our soil’s health a key focus – and as they say, ‘if you don’t measure it, you can’t manage it’. There has been a lot of interest around regenerative agriculture and carbon credits, and I also wanted to cut through the hype (which I often get slightly caught up in myself!) and get to the ‘so what?’ questions that need to be asked as well.
In many respects, Australia is one of the global leaders around soil carbon, and through the Clean Energy Regulator, we have the 2018 Carbon Credits Methodology ‘Carbon Farming Initiative – Measurement of Soil Carbon Sequestration in Agricultural Systems’, which sets out the framework for farmers to compliantly baseline their initial soil organic carbon levels, implement new activities on their land and, subsequently, go back in future years to remeasure and claim carbon credits for the gains that they can prove that they’ve made.
Current methodology ‘onerous’
The current methodology is relatively onerous from a compliance and auditing perspective, and these requirements have meant that it is not commercially viable for many farmers to be a part of the program. Off the back of these practical challenges for farmers and the carbon farming industry, the Clean Energy Regulator and the Department of Industry, Science, Energy and Resources are engaging with stakeholders to look at where changes can be made to the methodology. Coming from a technology perspective with our AgTech startup Platfarm, we are keen to see how software can make improvements to simplify the process of compliantly baselining farmland and track the work carried out to increase soil organic carbon from an auditing perspective.
There isn’t currently a soil carbon methodology that is specific to viticulture, which takes into account that we have different management practices for undervine versus mid rows, and we need an approach that ensures that we’re sampling both areas. This project is designed to be a pilot to practically illustrate and propose an approach that’s specifically relevant to our industry and is hopefully going to be a step forward in terms of getting one in place.
We had loads of great input and generous advice when we shared that we wanted to make a practical start in this area, and a big thanks to Timothy Cavagnaro, Joseph Marks and Thomas Lines from The University of Adelaide, Rebecca Tonkin from Natural Resources Adelaide and Mt Lofty Ranges, George Dridan at Integrated Precision Viticulture, the team at APAL Labs and Ed Scott from Field Systems.
A commercially realistic process for growers
Our objective was to demonstrate a method to rigorously baseline soil organic carbon levels that’s relevant for viticulture and that harnesses digital technology to make the process as efficient as possible. It also needed to be commercially realistic for growers (not least because our own 2020 grape cheque is looking decidedly ordinary!) and our target budget was to keep costs down to around $2,000.
We’d previously had a four-band EM38 map (‘Topsoil Mapper’) done of our soils by Field Systems and we imported this into the Platfarm app. This soil map was then used as a base layer to guide us to drawing four sampling zones which mapped against the changes in soil type, and in total, these made up our carbon estimation area (with the current methodology the minimum number of sampling zones is three).
|
|
When planning the baselining with Field Systems, our focus was to ensure that we were taking enough soil samples to adequately assess the variability of soil carbon stocks across the carbon estimation area. From research conducted by the CSIRO, when assessing spatial variation in soil carbon, a sample number of 25-30 cores across the assessment area is required (Conyers et al. 2018) to ensure the variability is captured in the dataset. Greater than 30 samples further confirms the degree of variability rather than identify greater variability. In light of this research, the project budget and the project layout, it was deemed that 24 samples across the 7ha was appropriate. |
We used the Platfarm app to drop six pins across each of the four zones, with three locations in the mid row and three positioned under vine. In the future, if growers are wanting to claim Australian Carbon Credit Units (ACCU), then this would need to be randomly generated, but we hadn’t created that level of functionality for the initial pilot.
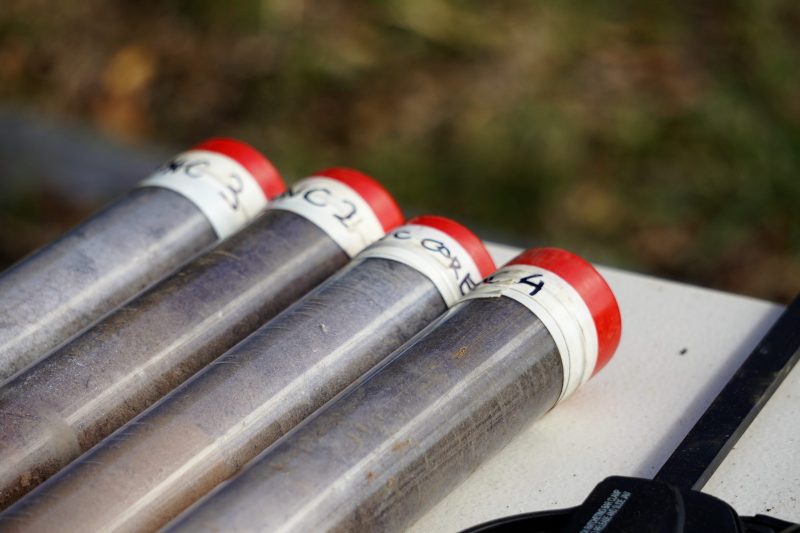
We brought in an independent coring contractor, Independent Precision Viticulture, who used Platfarm to drive to each of the exact locations to take the core. This coring contractor was selected due to the capacity to remove cores in clear plastic tubes rather than an unlined coring rig which would require samples to be bagged off at time of extraction. This allowed us to focus on core extraction in the field and then bag off samples back in the shed once all cores had been collected.
We decided to take the 40mm cores (greater than the minimum requirement of 38mm cores) down to 50cm, but we sub-sampled only the top 30cm to be sent to APAL Lab (which is the minimum requirement for ACCU guidelines).
To help lower costs and improve sampling efficiency, and to minimise waste, we put three 50cm cores in each 1.5m tube, and we put a round of sponge foam after each core to help identify the breaks between each core when the tube was opened, which proved to be a very handy step.
Measuring bulk density
Bulk density measurements calculated from core samples are readily fraught with uncertainty. Depending on the coring rig and moisture content, samples can either be dislodged in the core tube and effectively reduce bulk density or can compact to greater bulk density due to friction in the sampling tube. We identified an additional risk of compaction with putting three cores in a single tube, which would increase the bulk density reading, but as long as exactly the same method is used when re-baselining after 3-5 years or so, then that won’t be a factor in terms of the changes that are being picked up. During the baseline sampling, soil scientist Rebecca Tonkin, from Natural Resources Adelaide and Mt Lofty Ranges, manually measured bulk density at a cross section of sites to compare the core extracted bulk density readings with manually extracted bulk density ring measurements.
From a digital technology perspective, a primary focus is to create simple-to-use software that creates a really clear audit trail.
- Each of the locations were identified as either under vine or mid row, and each had their own unique identifier Zone (x) Location (y).
- Platfarm recorded the path that the soil corer took and the order that the soil cores were taken, and there was a GPS location saved at each spot.
- Each core was numbered by physically writing on the tube.
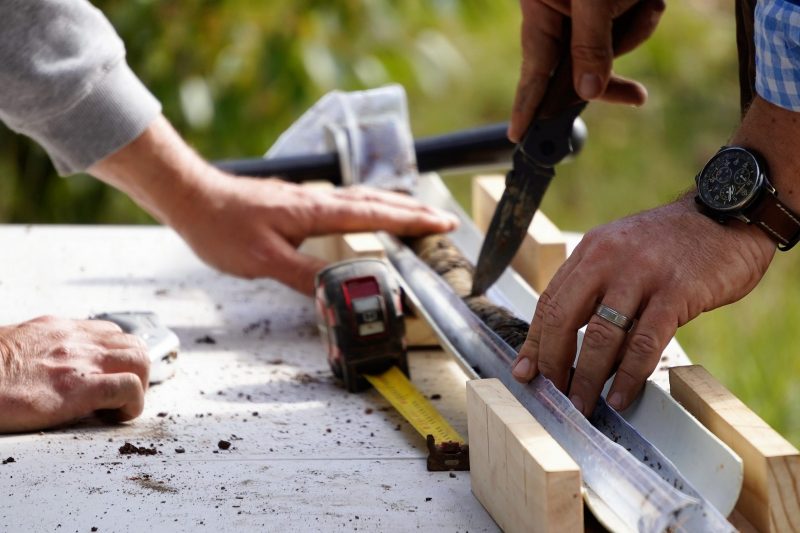
We opened up the cores once we’d got them all back to the shed – Ed Scott had a core tray (aka a glorified PVC gutter from Bunnings) that the cores were opened in – and we created an efficient production line where the cores were opened and the top 30cm was measured out and put in separate sample bags for APAL Labs, with our location reference ID from Platfarm written on them. (Note to self – opening soil cores with a Stanley knife is highly dangerous – please use a proper core-cutting tool).
APAL Labs did a specific soil carbon test to conform to the Energy Reduction Fund methodology. This includes total carbon, organic carbon, assessment of inorganic carbon (e.g. calcium carbonate), moisture content, gravel content, bulk density and particle size analysis. APAL also conducted mid infrared (MIR) assessment of organic carbon on each sample so this will be beneficial for future analysis as our baseline samples will be calibrated with the MIR. In an ideal world, growers would take a separate core for both SOC and bulk density for ease of analysis from a lab workflow perspective, but that didn’t make commercial sense for this pilot.
More innovation to come
There is likely to be lots of innovation around soil carbon over the coming seasons, with companies such as FarmLab (www.farmlab.com.au) creating soil maps and zones using satellite imagery; Hone AG (www.honeag.com) enabling in-field soil carbon measurement, and Nori (www.nori.com) launching a private global carbon credits market, being some of the innovators to watch. Hopefully a really collaborative approach from OpenTEAM (www.openteam.community) that brings together researchers, startups and brands will also spread from the US to Australia.
So, getting to some of the answers of the ‘so what’ questions:
- From a grower’s perspective, soil organic carbon is a logical key performance indicator to track in terms of the overall health of your soils and one of the benefits of increasing it will be to improve the vineyard’s resilience to climate extremes.
- Hopefully this article has helped to share the practical steps that growers can take to rigorously baseline their vineyards, that takes into account the different management practices mid row compared to undervine
- The objective of this pilot is that it informs a future methodology for viticulture that the Clean Energy Regulator will recognise.
- At the moment, selling carbon credits isn’t likely to be commercially viable for many growers and, as per the point below, we don’t yet have a methodology for our industry. But getting vineyards rigorously baselined at this point in time is still a practical step in the right direction from purely a management perspective, and you’ll have ‘drawn a line in the soil’ as a starting point.
This case study will also be a part of content created with the Langhorne Creek wine region for the project Resourcing Growers for the Future (supported by Wine Australia), on how remotely sensed imagery can be practically utilised by growers. In this instance, it’s four band EM38 imagery that’s directing where the soil sampling zones are drawn.
References
Photos courtesy of Nicole Motteux
This article was originally published in the June issue of The Australian & New Zealand Grapegrower & Winemaker. To find out more about our monthly magazine, or to subscribe, click here!
To view the current issue of the Grapegrower & Winemaker, visit our Current Issue page.